There's one thing that unites everyone who works with data: the spreadsheet that gets out of hand. It starts with four columns and ends with 47 tabs, three broken macros, and a coworker who "urgently needs access." Google just launched Sheets Canvas, a feature that turns your spreadsheet data into interactive panels using Gemini, without leaving Google Sheets. And an important caveat worth flagging early: we don't know if it's available outside the US.

TL;DR: The short version, no fluff
- Canvas in Sheets: Google adds an interactive canvas to Sheets. Describe what you need in plain language and Gemini builds the panel with cards, charts, and filters.
- Read-write: changes in the canvas update the sheet and vice versa in real time. Essentially a mini-app built on top of your data.
- For marketing: useful for campaign reports, KPIs, and e-commerce dashboards. Not a paid media tool, just a better way to present data you already have in Sheets.
- Europe unconfirmed: the official source doesn't say whether the rollout covers Spain or the European Economic Area.
Availability in Spain/EU: Unconfirmed
The source does not confirm availability in Spain/EU. Phase: general availability (GA). Eligibility: Google Workspace and Google One.
What Is Google Sheets Canvas?
Sheets Canvas is a new Google Sheets feature, now in general availability (GA), that adds a visual, interactive canvas inside the spreadsheet itself. Instead of staring at rows and columns, you describe to Gemini what you need in plain language, and the AI builds a visual interface on top of your data. According to Google's official announcement, Canvas lets you create metric cards, interactive charts, Kanban boards, and filtering controls.
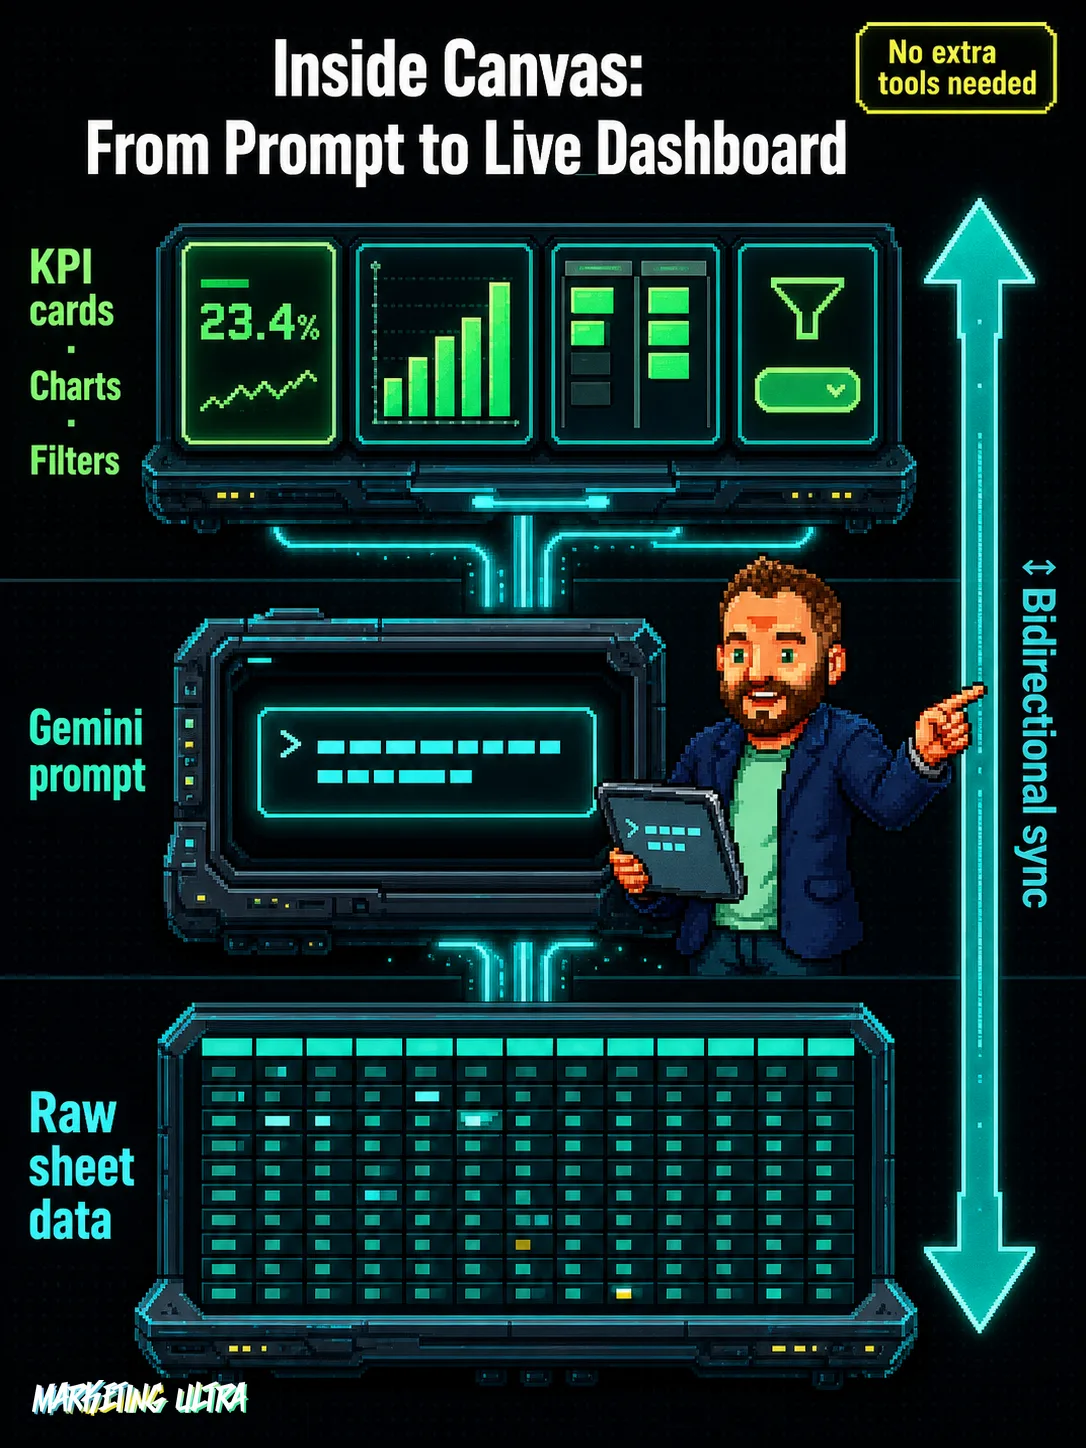
And the shift from classic Sheets goes well beyond the visual.
In classic Sheets, a chart is an image glued to the data. In Canvas, it's an interactive block you can filter, rearrange, and edit. Whatever you change in the canvas updates in the sheet. And vice versa. That bidirectional sync is the real deal. You end up with a lightweight app over your data that you can touch and modify live.
How It Works: Gemini Builds the Panel, You Call the Shots
The flow is straightforward. Open your sheet, select "Create Canvas" from the Gemini panel or the Insert menu, and tell it what you need: "Give me a performance dashboard with CPA cards, a bar chart by channel, and date filters." Gemini processes the request and generates modular blocks: KPI cards, charts, condensed tables, filtering controls.
Why isn't this just another pretty demo? Because Canvas is read-write. If you drag a card from "In Progress" to "Done" on a Kanban board, the corresponding cell in the sheet updates automatically. That's real workflow management. You can refine the design with follow-up prompts ("add a country filter," "switch to a line chart") without touching a single formula.
Does Sheets Canvas Make Sense for a Marketing Team?
Yes. But probably not for the reason you're thinking.

Sheets Canvas doesn't optimize campaigns. It's not a paid media tool or a replacement for your ad platform. But if you manage marketing data in spreadsheets, and be honest, everyone does, it solves a real problem: turning a chaotic sheet into something your boss can actually read without a guided tour through every column.
Where does it fit?
- Campaign reports: consolidate metrics from multiple sources (impressions, clicks, conversions, CPA) in one sheet and spin up an interactive dashboard. No opening Looker Studio, no sharing extra access.
- KPI tracking: cards with key indicators, filters by period, channel, or team. The manager opens the sheet and sees a dashboard, not a wall of numbers.
- E-commerce: sales by product, category, trends, inventory. Visual, interactive, and inside the sheet where the data already lives.
Here's the angle most people aren't talking about. Google already has Looker Studio for exactly this. Are they cannibalizing themselves? Probably, and deliberately. The strategy is to keep you inside Workspace. If you can build a solid report without opening another tool, Tableau and Power BI stay in the drawer. Most reports a marketing team needs don't require a full BI stack: they need a spreadsheet that doesn't look like a spreadsheet. Canvas covers that exact gap.
The risk? That the ease of building dashboards from a single prompt produces polished reports built on the wrong questions. A pretty dashboard tracking the wrong metrics is still useless. And with an AI that says yes to everything without asking whether you're measuring the right things, that's a real danger.
Sheets Canvas Availability: What We Know and What We Don't
Sheets Canvas has reached general availability (GA) for Google Workspace subscribers (Business, Enterprise, Education) and Google One (AI Pro and Ultra plans), according to the Google Workspace Updates blog.
Europe: unconfirmed. The official source doesn't specify whether the rollout includes Spain or other European Economic Area countries. Access from Europe can be neither confirmed nor ruled out. If you have Workspace, the fastest check is to open a sheet and look for "Create Canvas" in the Gemini panel, if the option isn't there, your region probably isn't in the rollout yet.
If your reports live in Sheets and you're manually polishing them every Monday morning, this takes that chore off your plate. Will it replace a serious BI tool? Not a chance. But I'd bet most teams are about to find out they never needed one.