Graphic Walker turns data into charts by dragging fields around, without forcing you to build a business intelligence behemoth. It is an open-source alternative to Tableau designed to be embedded in React applications, although being lightweight does not remove the technical work or magically turn any CSV into a brilliant decision.

TL;DR: The No-Nonsense Summary
- What it is: a visual analytics component with charts, filters and drag-and-drop exploration.
- Who it is for: teams that want to add analytics to a React application or explore data in the browser.
- Cost: the project uses an Apache-2.0 licence; enterprise services and infrastructure may incur separate costs.
- The decisive limitation: it is not install-and-forget; data integration, permissions, translations and remote computing require development work.
In this article
| What it is | An open-source drag-and-drop visual analytics component designed to be embedded in React applications as a lightweight alternative to Tableau. |
|---|---|
| Official website | https://kanaries.net/graphic-walker |
| Repository | repo |
| Licence | Apache-2.0 |
| Price | open source |
| Alternative to | Tableau |
| GitHub stars | 3,249 |
| Release year | 2022 |
| Maintained by | Kanaries (organisation) |
| Platforms | Web (online), React component (embeddable), self-hosted |
| Requirements | Node/npm or yarn to install; optionally, your own server for server-side computing |
| Integrations | DuckDB, ClickHouse, StarRocks, Snowflake, PyGWalker, Vega-Lite, react-i18next |
| Language | English, Simplified Chinese and Japanese included; Spanish support through custom i18n resources |
Reviewed on 2026-10-02
This tool is part of the living roundup Open-source applications that replace paid software →
The Problem It Solves
Graphic Walker addresses a fairly specific need: letting someone explore data visually inside a web application without building every chart, filter and selector from scratch. The project describes itself in its official repository as a lightweight, easy-to-embed open-source alternative to Tableau.

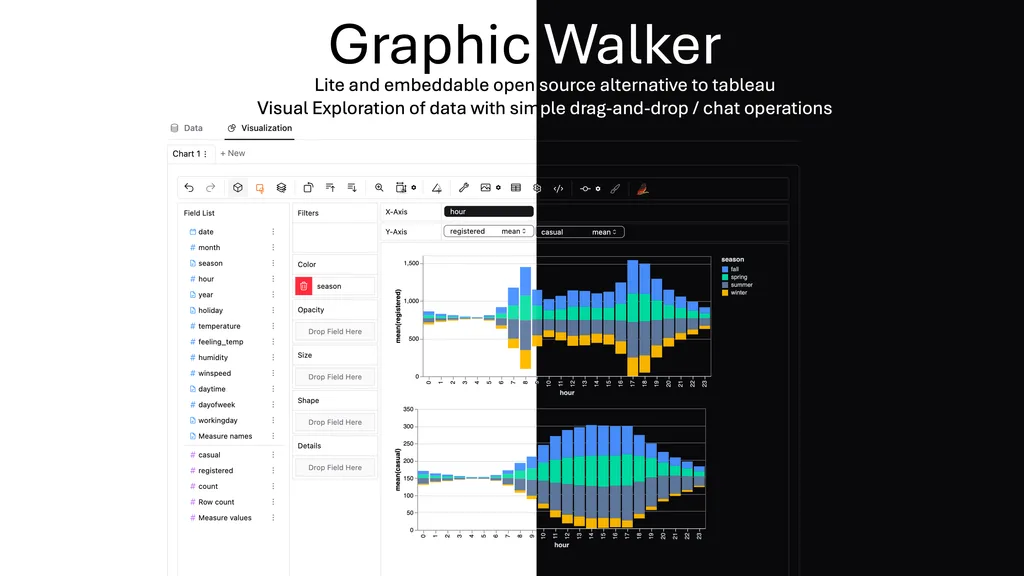
Users can load CSV or JSON data, inspect the columns and classify them as dimensions or measures. They then drag those fields into rows, columns, colour or other visual channels. They can also change aggregations, create split views and save the result in a local file to retrieve later.
The important word here is “component”. Graphic Walker lives inside another product, avoiding the full monolithic business intelligence platform outfit. For a SaaS product that needs to offer charts to its customers, that makes far more sense than dropping in an iframe that looks like a corporate spaceship.
Getting Started
The quickest route requires no installation: there is an online version for loading a dataset and exploring the interface. It is useful for understanding the workflow, not for proving how it will behave inside your app, with your permissions and your actual data volume.
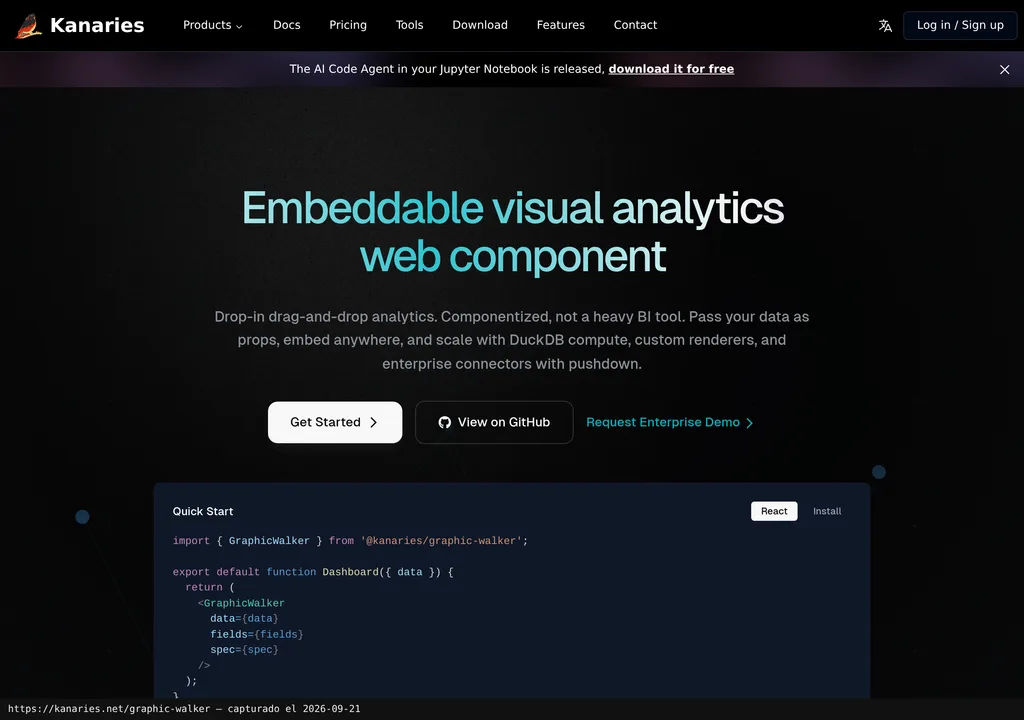
To embed it, the documented requirements are a React project and an environment with npm or yarn. Install the package with yarn add @kanaries/graphic-walker or npm i --save @kanaries/graphic-walker. You then import GraphicWalker and pass it the data and field definitions as properties.
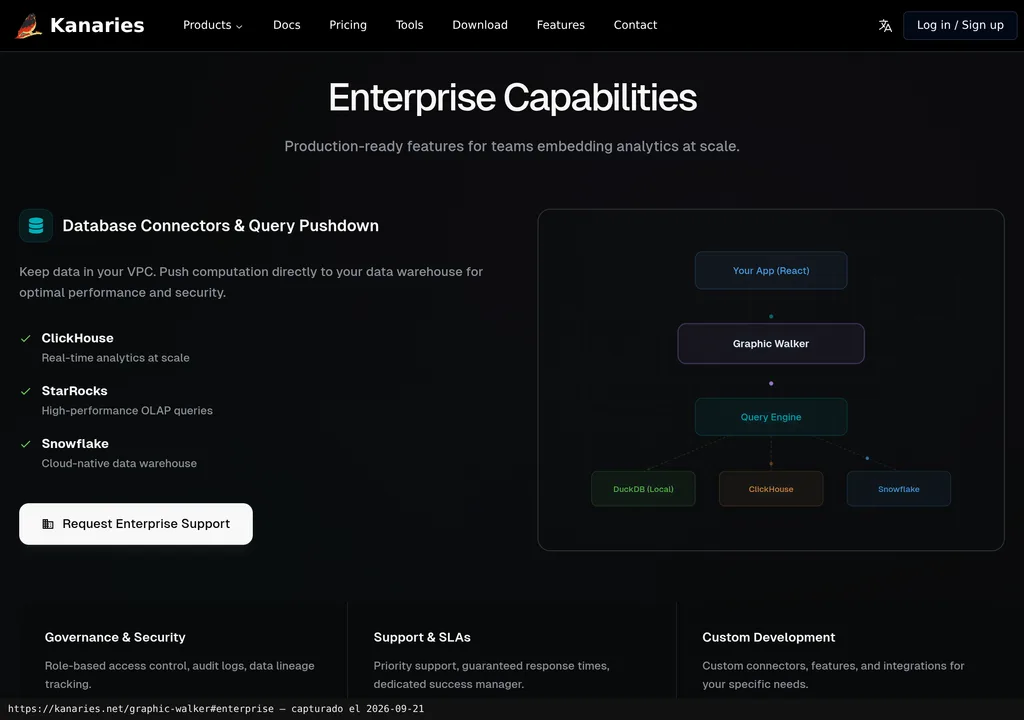
By default, computing runs in the browser, mainly through Web Workers. You can also delegate it to your own service. The official site mentions DuckDB for local computing and enterprise connections that send queries to ClickHouse, StarRocks or Snowflake. That is where the button-clicking ends: behind it sit architecture, access control and maintenance.
English, Japanese and Simplified Chinese are included. Spanish requires supplying your own resources through i18nResources. Keep that in mind, because “supports Spanish” does not mean “ships with a finished Spanish translation”.
Copy this and paste it into Claude Code, Cursor or your favourite coding assistant:
Install @kanaries/graphic-walker from https://github.com/kanaries/graphic-walker in a React app.
Create a screen with five fictional campaign rows, with date, channel, spend and conversion fields.
Check that I can drag channel and spend to generate a chart, and document how to remove the component.
Review the result before using it. Installation, configuration and testing depend on the assistant and environment you use.
Using It in Real Marketing
A sensible use case would be adding a view to an internal tool where the team can explore campaigns by channel, date, spend and conversions. Producing yet another bar chart is not exactly groundbreaking. The value lies in letting each stakeholder change dimensions and measures without asking the development team for a new screen.
We have not run our own test of Graphic Walker, nor do we have results supplied by Dani. That should be clear. This scenario explains a possible use supported by documented features, but it does not prove performance, time savings or reliability with real advertising data.
The trap appears before the chart. If campaigns arrive with inconsistent names, mixed currencies or poorly defined conversions, the interface can only render the chaos in prettier colours. Graphic Walker makes exploration easier; the judgement required to prepare and interpret data remains human.
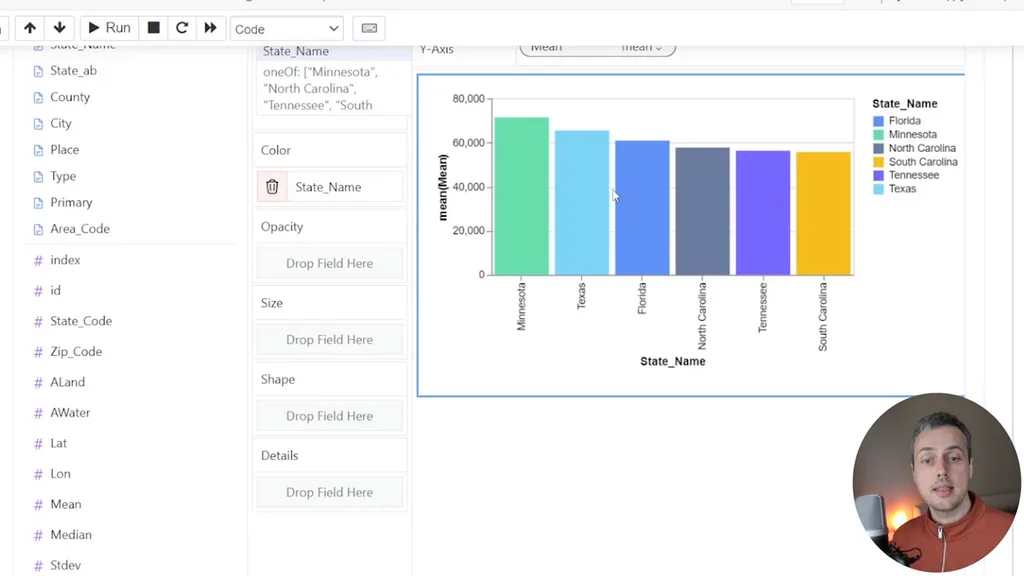
The documentation shows a real interface with a field list and visual channels. This workspace screenshot confirms the layout of those controls, but does not prove speed or ease of learning. The bar chart screenshot shows the output of one specific feature, not how it behaves with millions of rows.
What They Do Not Tell You
The Apache-2.0 licence lets you build on the open project without paying a package fee. That does not make every deployment free: hosting, development, databases, support and connectors can create costs of their own.
Kanaries publishes commercial services priced in US dollars, but the dossier provides no official, dated conversion to euros. We are not going to dress up a rough conversion as a European price. Before signing up, ask for the current EUR price, billing period, per-domain unit and tax treatment.
Evidence is missing on maximum performance, full accessibility and the security of a multi-user deployment. The commercial site talks about role-based control, auditing and lineage among its enterprise capabilities. That is the vendor’s description, not an independent audit.
To undo the integration, remove the component, its imports and the project dependency. The documentation provided does not explain a step-by-step rollback or confirm what happens to saved configurations. Better to test the exit before marrying it to an important application.
What People Say
On Hacker News, user ensemblehq said they had been looking for something similar and planned to try it and contribute. It is a signal of interest from one user, not a later evaluation or verified business case; the dossier does not provide their role or publication date.
"Perfect timing as I'm looking for something like this (was going to build this but happy to contribute!). I'll give it a go! Thanks!" ensemblehq on HN
"This looks cool, but hopefully does not run afoul of Tableau's (and now Salesforce's) many patents in that space. IIRC part of the reason certain features couldn't make it into Microsoft's PowerBI was because of those." dafelst on HN
"Interesting area and well done on the work ! Have you looked at https://perspective.finos.org/ ? It has at least some overlaps and can manage pretty big datasets by levering Arrow in WASM in the browser." freeman478 on HN
Another user, dafelst, raised questions about possible patents around this type of functionality. The original comment is in the Hacker News thread. It is the author’s concern, not a legal conclusion. Freeman478 also pointed out the overlap with Perspective and its use of Arrow in WebAssembly. Three useful comments for raising questions. A satisfaction survey, absolutely not.
Alternatives
The alternative identified in the product sheet is Tableau. The comparison needs a scalpel, though: Tableau is a broad business intelligence platform, while Graphic Walker presents itself as a lightweight embeddable component. Replacing one with the other depends on connectors, data governance, collaboration, support and the product you already have in place.
If you need to explore data inside a React application and want control over the interface, Graphic Walker is a better fit for the problem described. If you want to replace an entire existing corporate environment in one hit, the available documentation is not enough to promise that migration. Not a chance.
Verdict
Graphic Walker deserves a place in an open-source roundup because it solves a difficult, reusable piece of the puzzle: putting interactive visual analytics inside another product. It has an Apache-2.0 licence and a public repository. That lets you evaluate the project, but does not guarantee its future quality.
I would recommend it for prototyping with non-sensitive data or evaluating embedded analytics in React. I would not choose it yet as a complete Tableau replacement without testing volume, permissions, accessibility, maintenance and enterprise cost in the real environment.
Graphic Walker puts a fairly serious interface within the team’s reach. The data, governance and decisions are still your problem. As they should be.