Documenting a database by hand has something of a medieval punishment about it: by the time you finish the diagram, the schema has already changed. ChartDB turns an SQL schema into an editable diagram and lets you export it back as DDL, but the documentation provided leaves too many questions unanswered about installation and the AI component.

TL;DR: The No-Nonsense Summary
- What it does: imports a schema through a query, represents it visually, and lets you edit it.
- What it delivers: it can export DDL and proposes AI-assisted migrations between SQL dialects.
- Cost: it is open-source software under the AGPL-3.0 licence; the dossier does not substantiate infrastructure costs.
- Decisive drawback: the documentation provided does not make it possible to verify requirements or a reproducible installation process.
In this article
| What it is | A database diagram editor that imports your schema with a query and lets you edit it visually, export DDL, or migrate between SQL dialects with AI. |
|---|---|
| Official website | https://chartdb.io/ |
| Repository | repo |
| Licence | AGPL-3.0 |
| Price | open source |
| Alternative to | DrawSQL, dbdiagram.io, SQLDBM |
| GitHub stars | 22,937 |
| Launch year | 2024 |
| Maintained by | chartdb (organisation) |
Reviewed on 2026-10-04
This tool is included in these collections: Open Source Apps That Replace Paid Software
The Problem It Solves
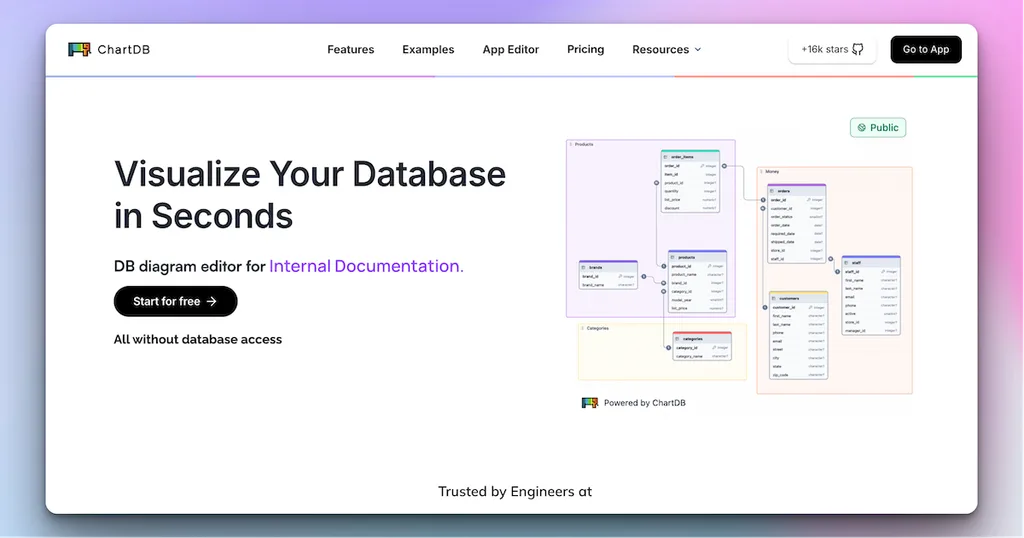
ChartDB is a database diagram editor: it takes a schema, turns it into a visual representation, and lets you modify it.
The pain point is very down to earth. Schemas grow, documentation falls behind, and explaining a database to someone in marketing, analytics, or product ends in a video call with twenty rectangles shared on screen. Boom. Nobody knows which table was the right one anymore.
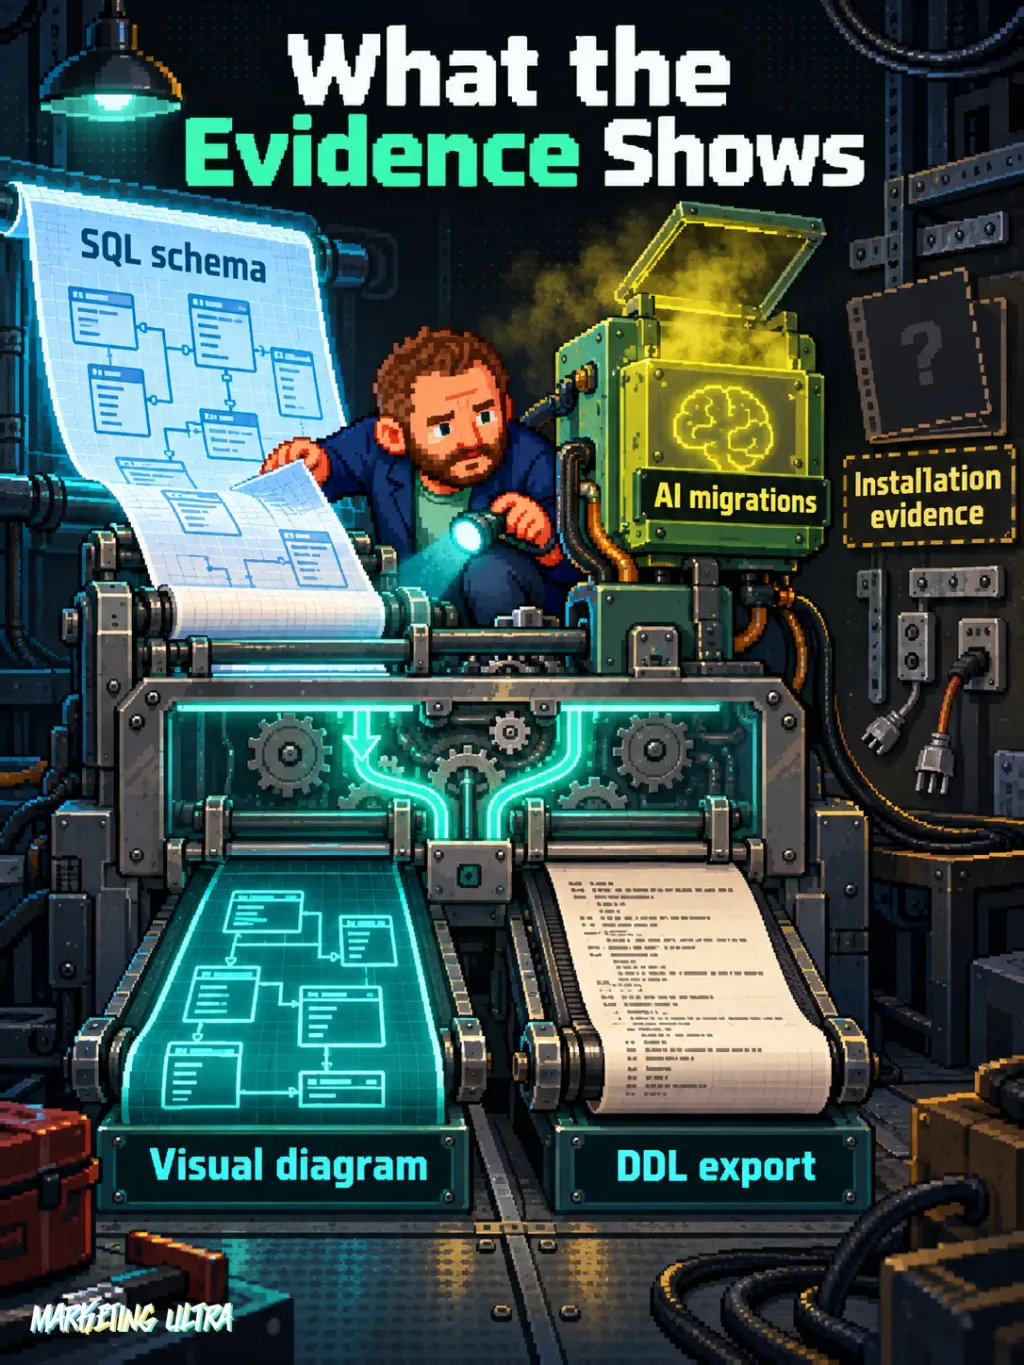
According to the official ChartDB website, the product is positioned as a database schema diagram visualiser. The verified product sheet adds more detail: you can import a schema with a query, edit it visually, and export DDL. It also mentions AI-assisted migrations between SQL dialects.
Put simply: ChartDB helps you create a map of a database, alter that map, and turn the changes back into SQL instructions. It does not replace the judgement of the person who knows the data. It helps you see the ground before stepping on a mine.
Getting Started
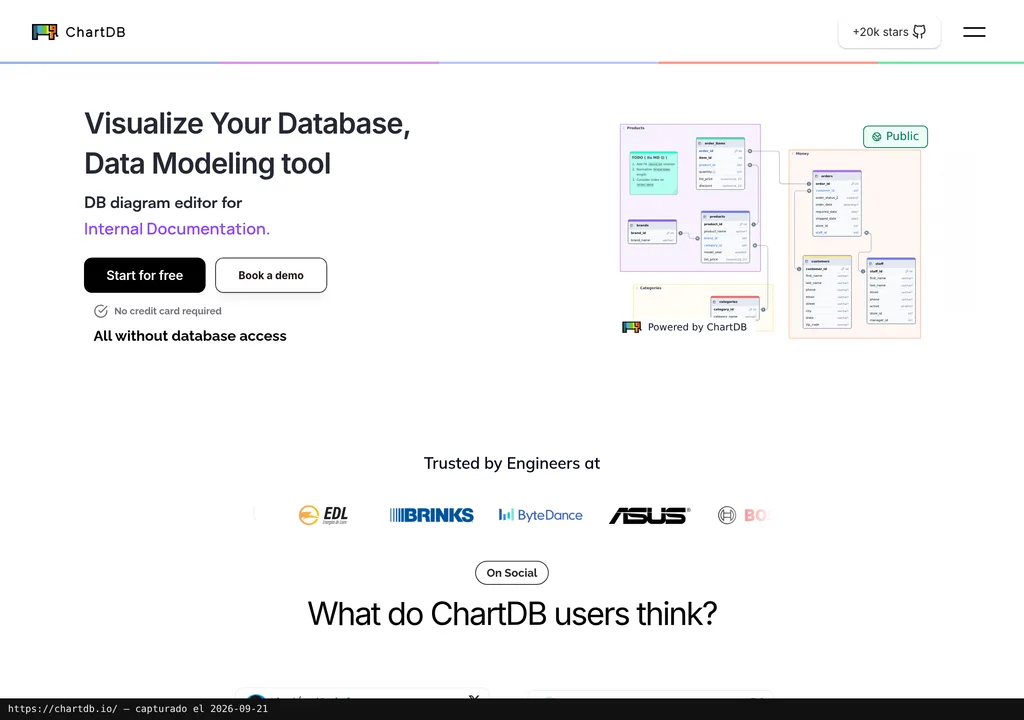
Here comes the first brake: the material provided does not make it possible to verify the installation. The supplied README is empty, and the website only presents ChartDB as a schema visualiser. Publishing specific commands, dependencies, or ports would mean making up the recipe.
The verifiable starting point is the official ChartDB repository on GitHub. Its current documentation, environment requirements, and deployment method should be checked there before installing anything. Popularity and activity figures also need to be verified directly in the repository. Stability must be demonstrated separately.
ChartDB is listed as open-source software under the AGPL-3.0 licence. The software licence is clear. What nobody has shown is that running it in production is free: the dossier does not detail hosting, AI model usage, third-party services, or maintenance. Saying zero euros without evidence is still zero rigour.
Copy this and paste it into Claude Code, Cursor, or your favourite coding assistant:
Review the official ChartDB repository at https://github.com/chartdb/chartdb and confirm its current requirements.
Install it using only the official documentation and explain how to undo every change.
Run it locally and test importing a sample schema and exporting its DDL, without using real data.
If you are not comfortable with the technical side, an assistant can guide you, but review every step: requirements and installation have still not been verified.
Using It in Real Marketing
The sensible marketing use case appears when data is spread across tables that almost nobody outside the technical team understands. Think of an agency that needs to locate campaigns, costs, conversions, and clients inside a data warehouse before preparing a report.
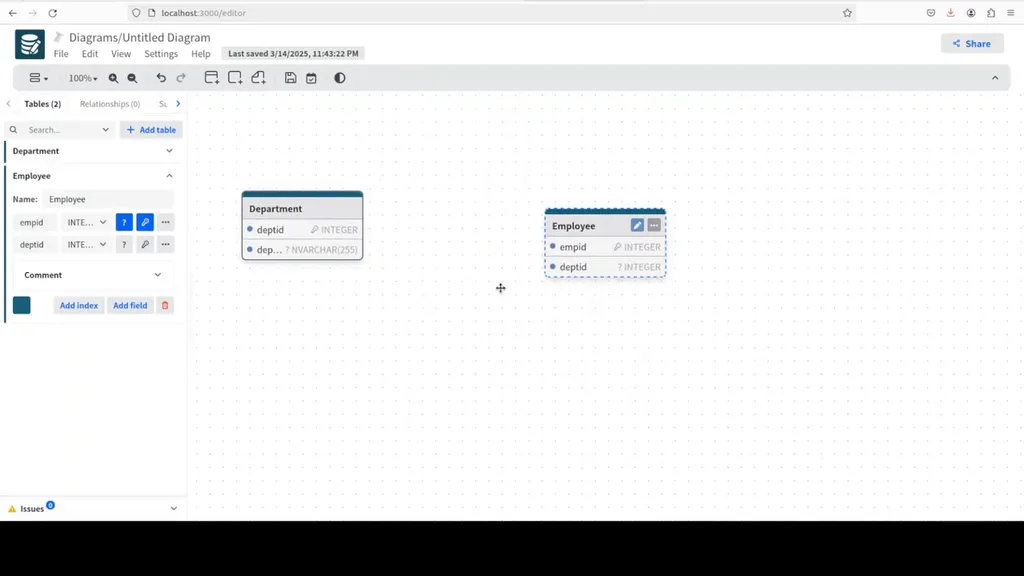
The scenario would be simple: a technical teammate imports a test schema and points out the relevant relationships. From there, analytics and paid media teams can discuss which fields they need without pretending everyone speaks SQL with divine fluency.
But to be clear: this is a use-case scenario. Dani and Marketing Ultra have not run this test. The dossier does not include an in-house practical trial or comparative results, although it does provide verified screenshots of the interface and application. Nor does it establish that ChartDB reduces time, prevents errors, or improves reporting. I would bet its value lies more in reducing misunderstandings than in speeding up queries. That is my reading. There is no measurement to support it.
What They Do Not Tell You
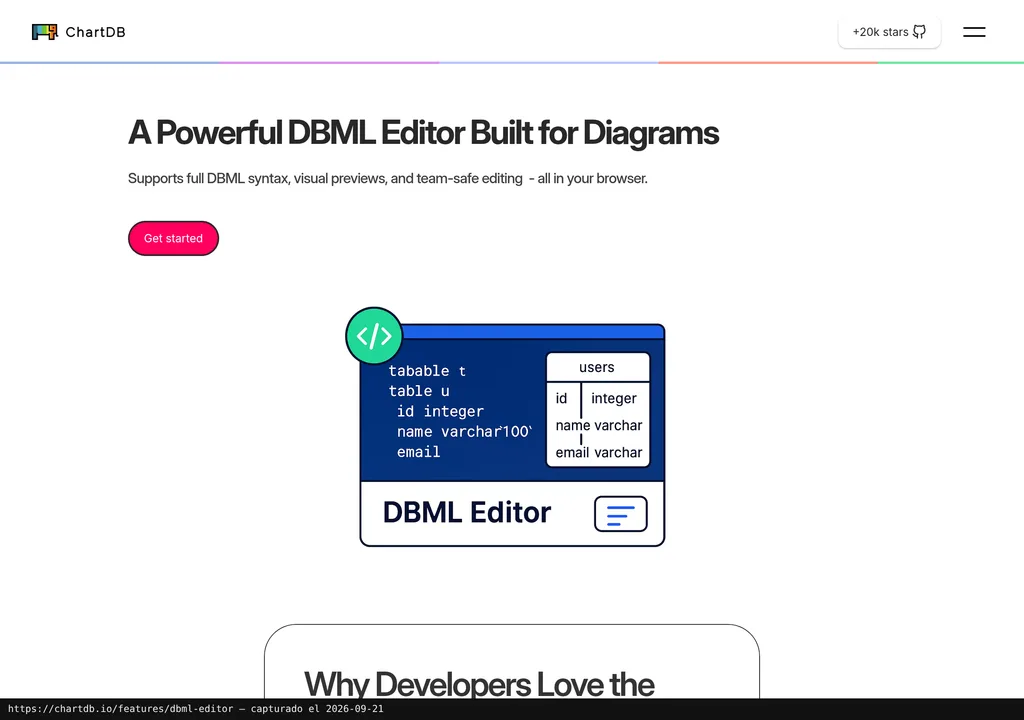
The main limitation of this analysis is the available evidence. There are verified screenshots from the ChartDB website, its interface, and the DBML editor page. What we do not have is an in-house practical test, verified requirements, a reproducible installation, or a trial of migrations between dialects.
AI is the blurriest part. The product sheet says it is involved in migrations between SQL dialects, but it does not explain which model it uses, where data is processed, which configuration it requires, or how accurate it is. With a real database, those questions matter. A lot. They affect privacy, cost, and operational risk.
A documented rollback path is also missing. Until the official deployment method is verified, it cannot be stated how it is updated, removed, or which components it leaves installed. The visual interface may look lovely; incorrect DDL can still create a beautiful mess.
What People Say
The public discussion provided comes from Hacker News and raises precisely the questions left open by the documentation. These are comments from platform users; the dossier does not identify their authors as maintainers or commercial customers, nor does it provide publication dates.
"nice work on chartdb, guys! can you elaborate on how the ai part works? im a bit confused how that fits in because there are many SQL diagram tools without AI as well" namanyayg on HN
"> visualize database schemas by generating ER diagrams with just one query > visualize and design your DB with a single query > Instantly visualize your database schema with a single "Smart Query." The tool seems really useful and I will give it a try! Just curious about the emph" andrelaszlo on HN
"This is cool, but there are a lot of visualizer, what's the difference?" gitroom on HN
namanyayg asked on Hacker News how AI fits in when many SQL diagram tools already exist without it. It is a valid objection: calling something AI does not yet explain its differentiator.
gitroom was even more direct: there are plenty of visualisers, so what is different? Another participant, andrelaszlo, considered the tool useful and said they planned to try it. Their comment is cut off, so it would be wrong to attribute anything else to them. Three comments do not make a consensus, but they do expose the editorial gap: ChartDB needs to explain more clearly what it adds beyond drawing schemas.
Alternatives
The alternatives identified in the product sheet are DrawSQL, dbdiagram.io, and SQLDBM. The dossier does not include licences, pricing, features, or comparative tests for those options, so there is no basis for declaring a winner.
The practical decision comes down to comparing the workflow that matters: compatibility with your database, how the schema is obtained, visual editing, DDL export, and the handling of sensitive data. If migrating between dialects is essential, demand a trial using a disposable schema before trusting it with anything serious.
Verdict
There is one certainty in ChartDB's favour: it is published under the AGPL-3.0 licence. That is enough to include it in a roundup of open-source applications; the project's real status still needs checking in its repository.
Would I recommend it? For a local trial with dummy data, yes. For connecting it to a real database or accepting an AI-generated SQL migration, not yet: verified requirements, processing details, and a reproducible test are still missing.
ChartDB may save you from drawing. The judgement needed to decide whether that drawing tells the truth is still yours. Thank goodness for that.